Data and anomaly visualization
Data, especially when there are large amounts of it, can quickly become unruly and difficult to understand. To this end, I have developed and collaborated on numerous data processing tools to make this task somewhat more tenable. This work spans my roles as analyst in the Auton Lab, doctoral student in the Soft Machines Lab, and research intern at Arieca. The gallery shows three examples, and we’ll discuss a few others below.
I had the privilege of collaborating with many people on these projects, which span over ten years of research. The development of these various tools was largely ancillary to the overarching goals of our work, but many have turned out to be quite useful, and some of them I am able to share.
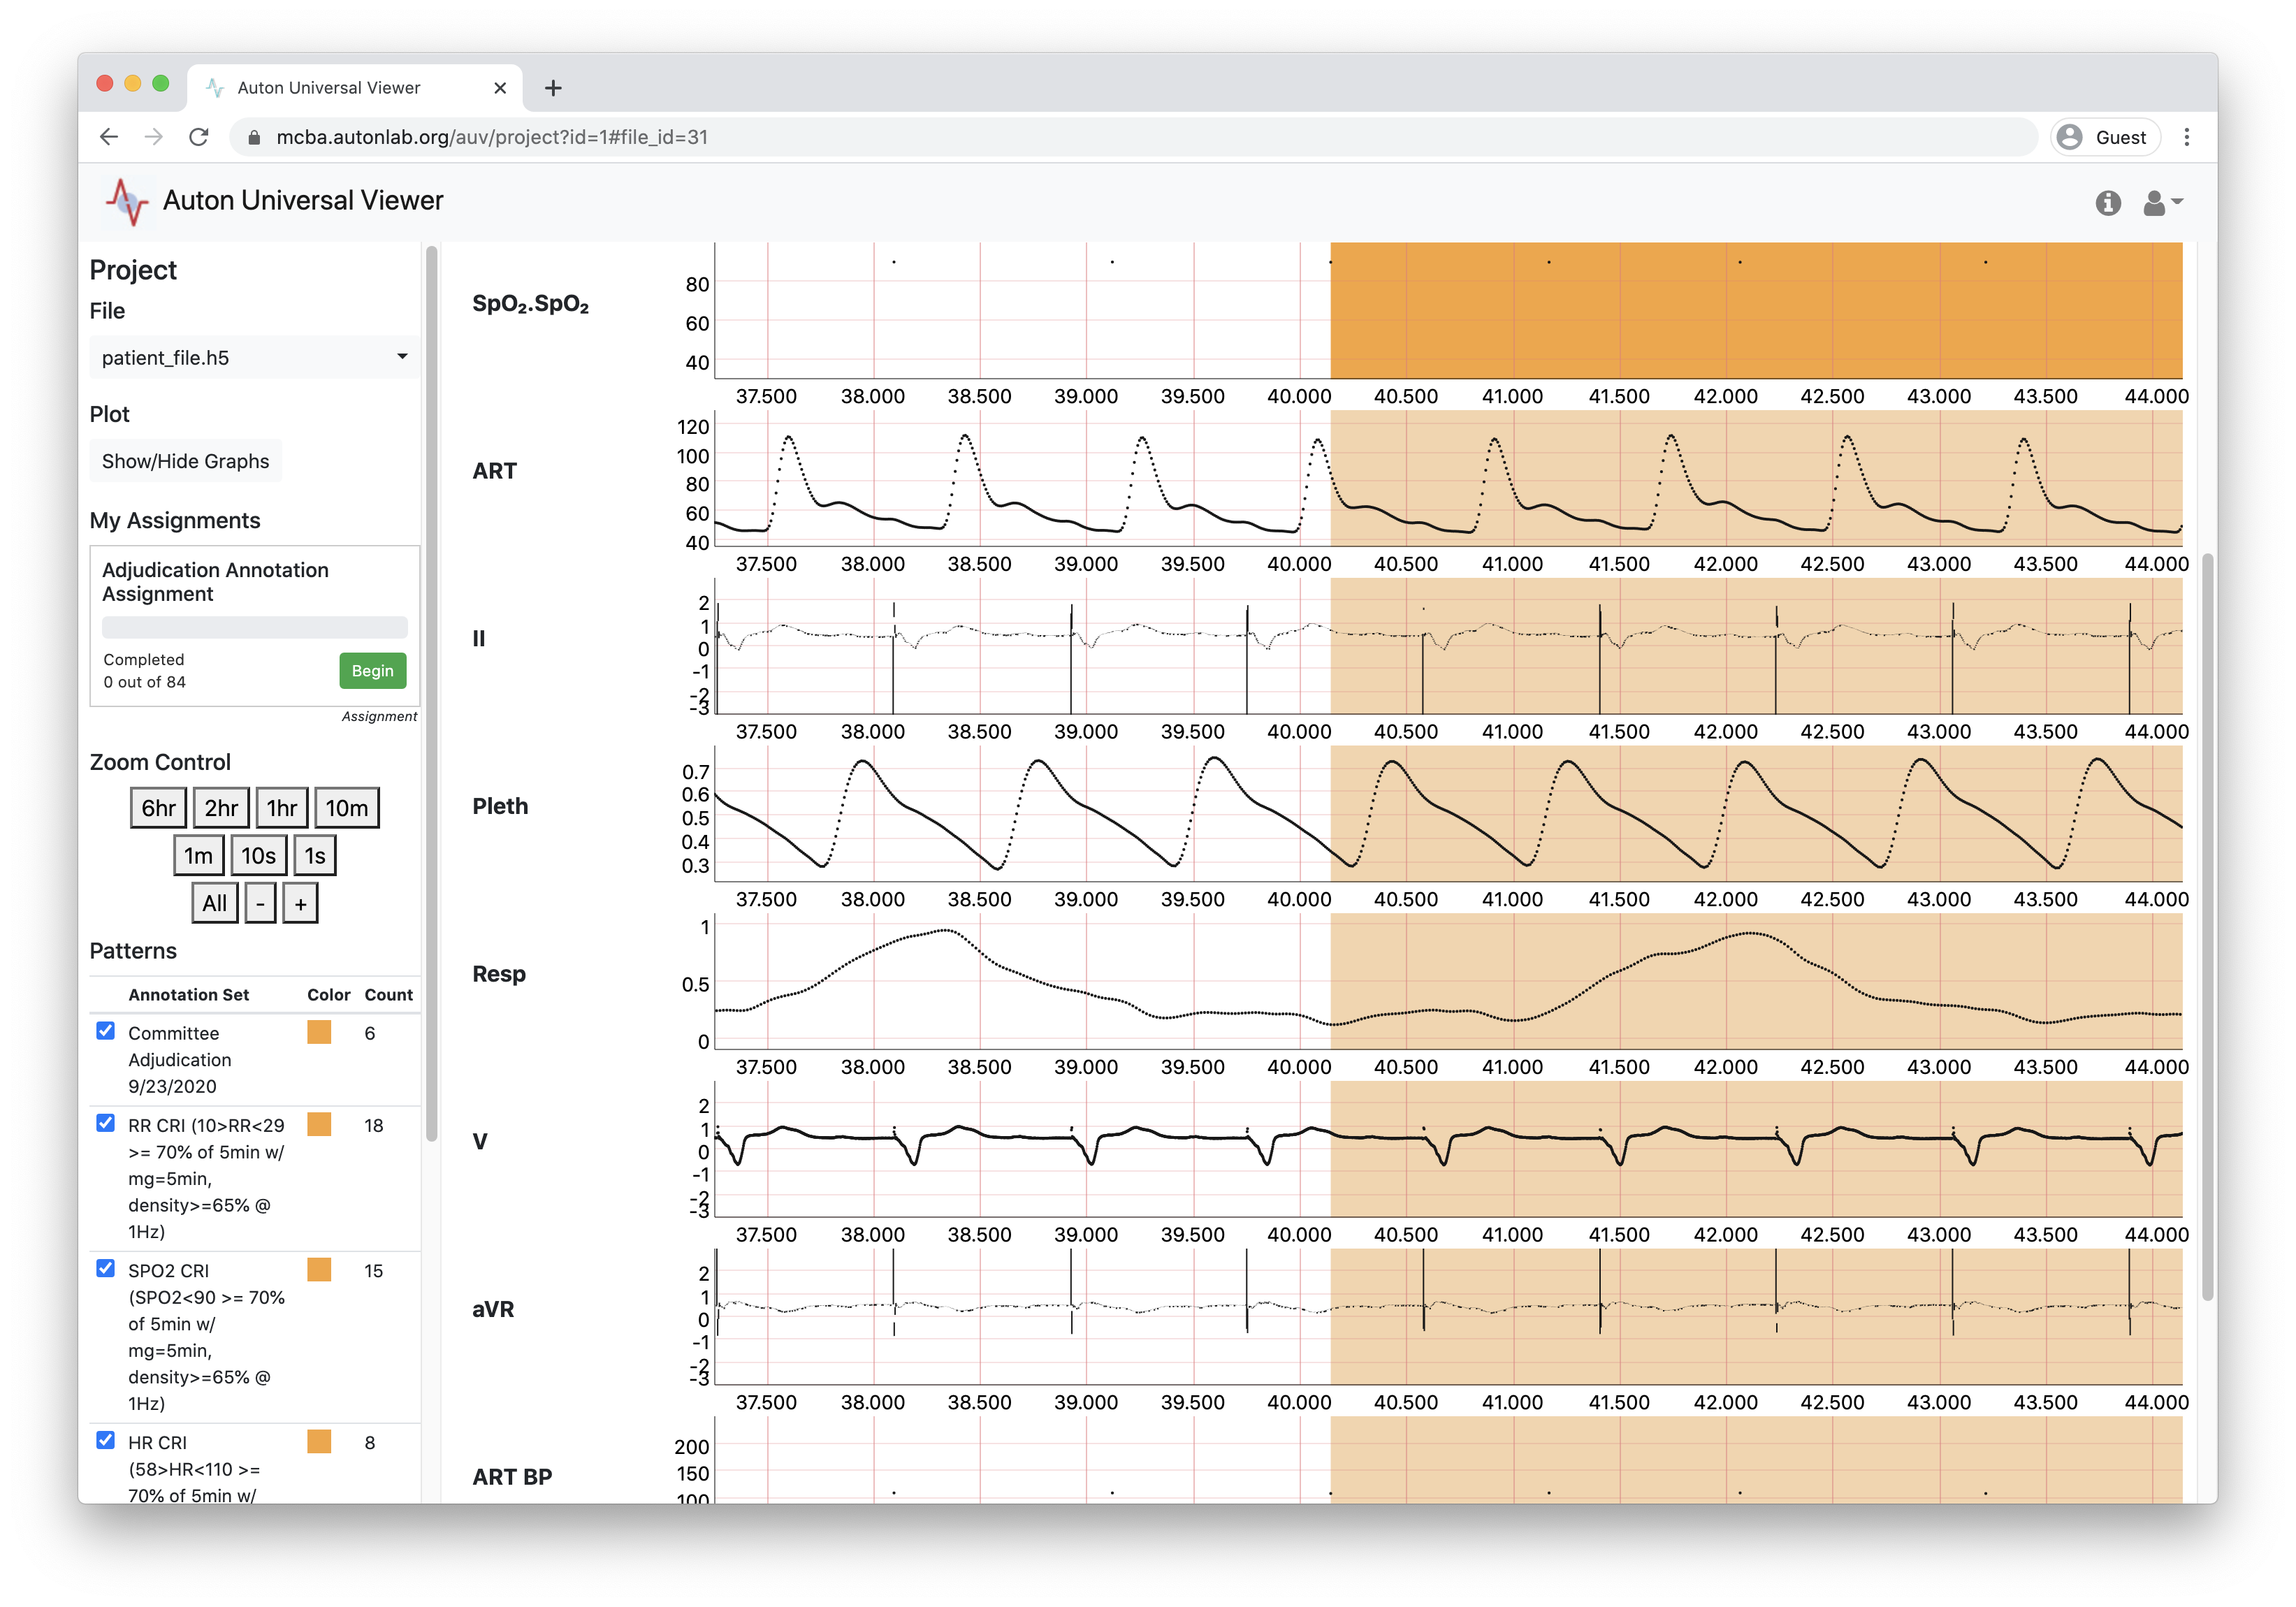
Figure 1 in the gallery is auviewer, an abbreviation of “Auton [Lab] Universal Viewer”.
It is an open-source biomedical data viewer, annotator, and analytics tool I helped develop for analyzing anomaly detection and other algorithms on large amounts of patient data.
I contributed much more heavily to its underlying data source, audata, which is an abstraction on top of HDF5 for dealing with large medical time series efficiently.
One relevant research outcome this was folded into is that on common data formats and tools in medicine (Laird et al., 2021).
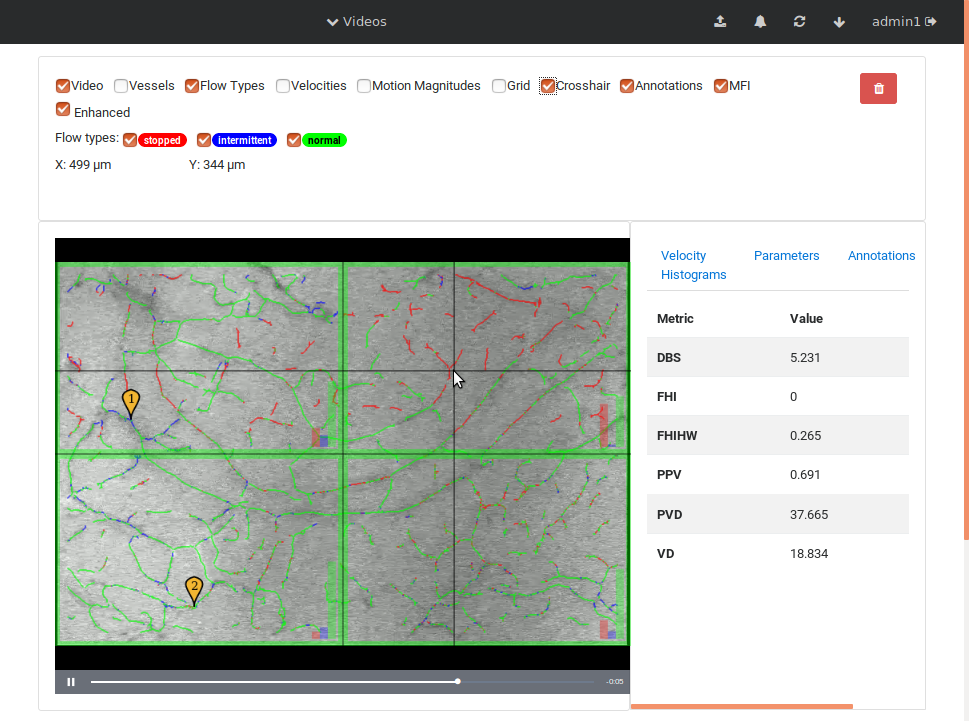
Figure 2 shows a tool I helped develop to view videos of microcirculation which went through a video processing pipeline to extract information about bloodflow. You can find more information about that on the MCBA project page or check out the related research (Liu et al., 2015).
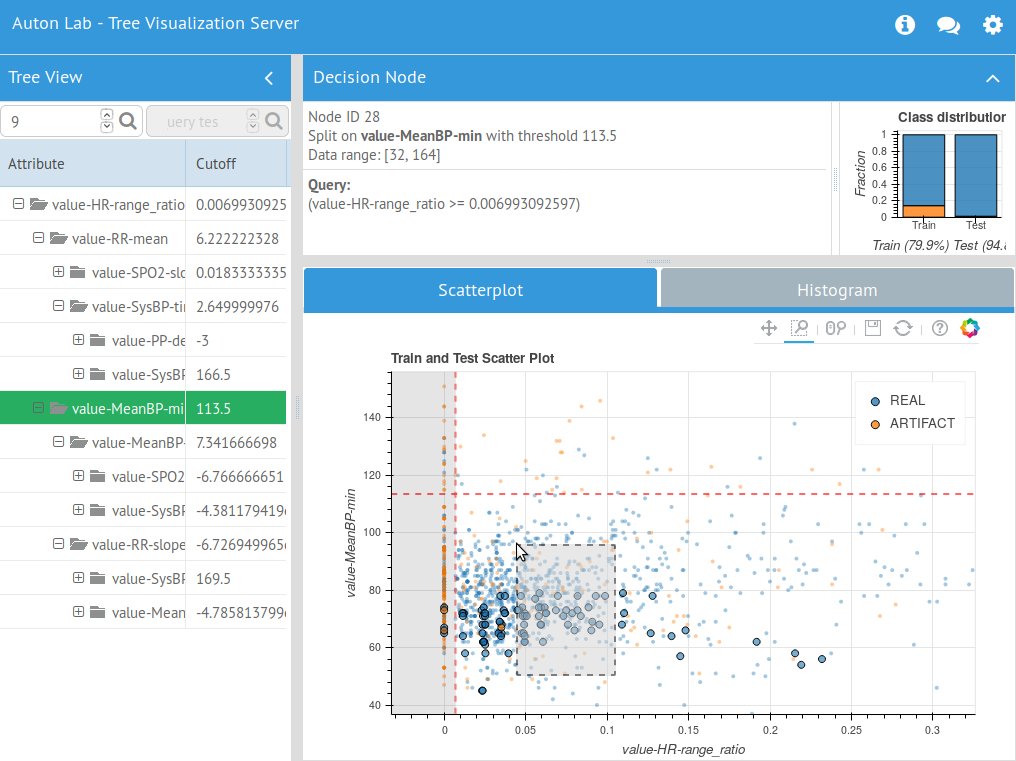
Figure 3 shows a tool I developed to process decision trees in random forest classifiers and use them to analyze both the data they were trained on as well as testing data. This was incredibly helpful in debugging bad features or understanding why a classifier did or did not work, and the tool found much use on various projects.
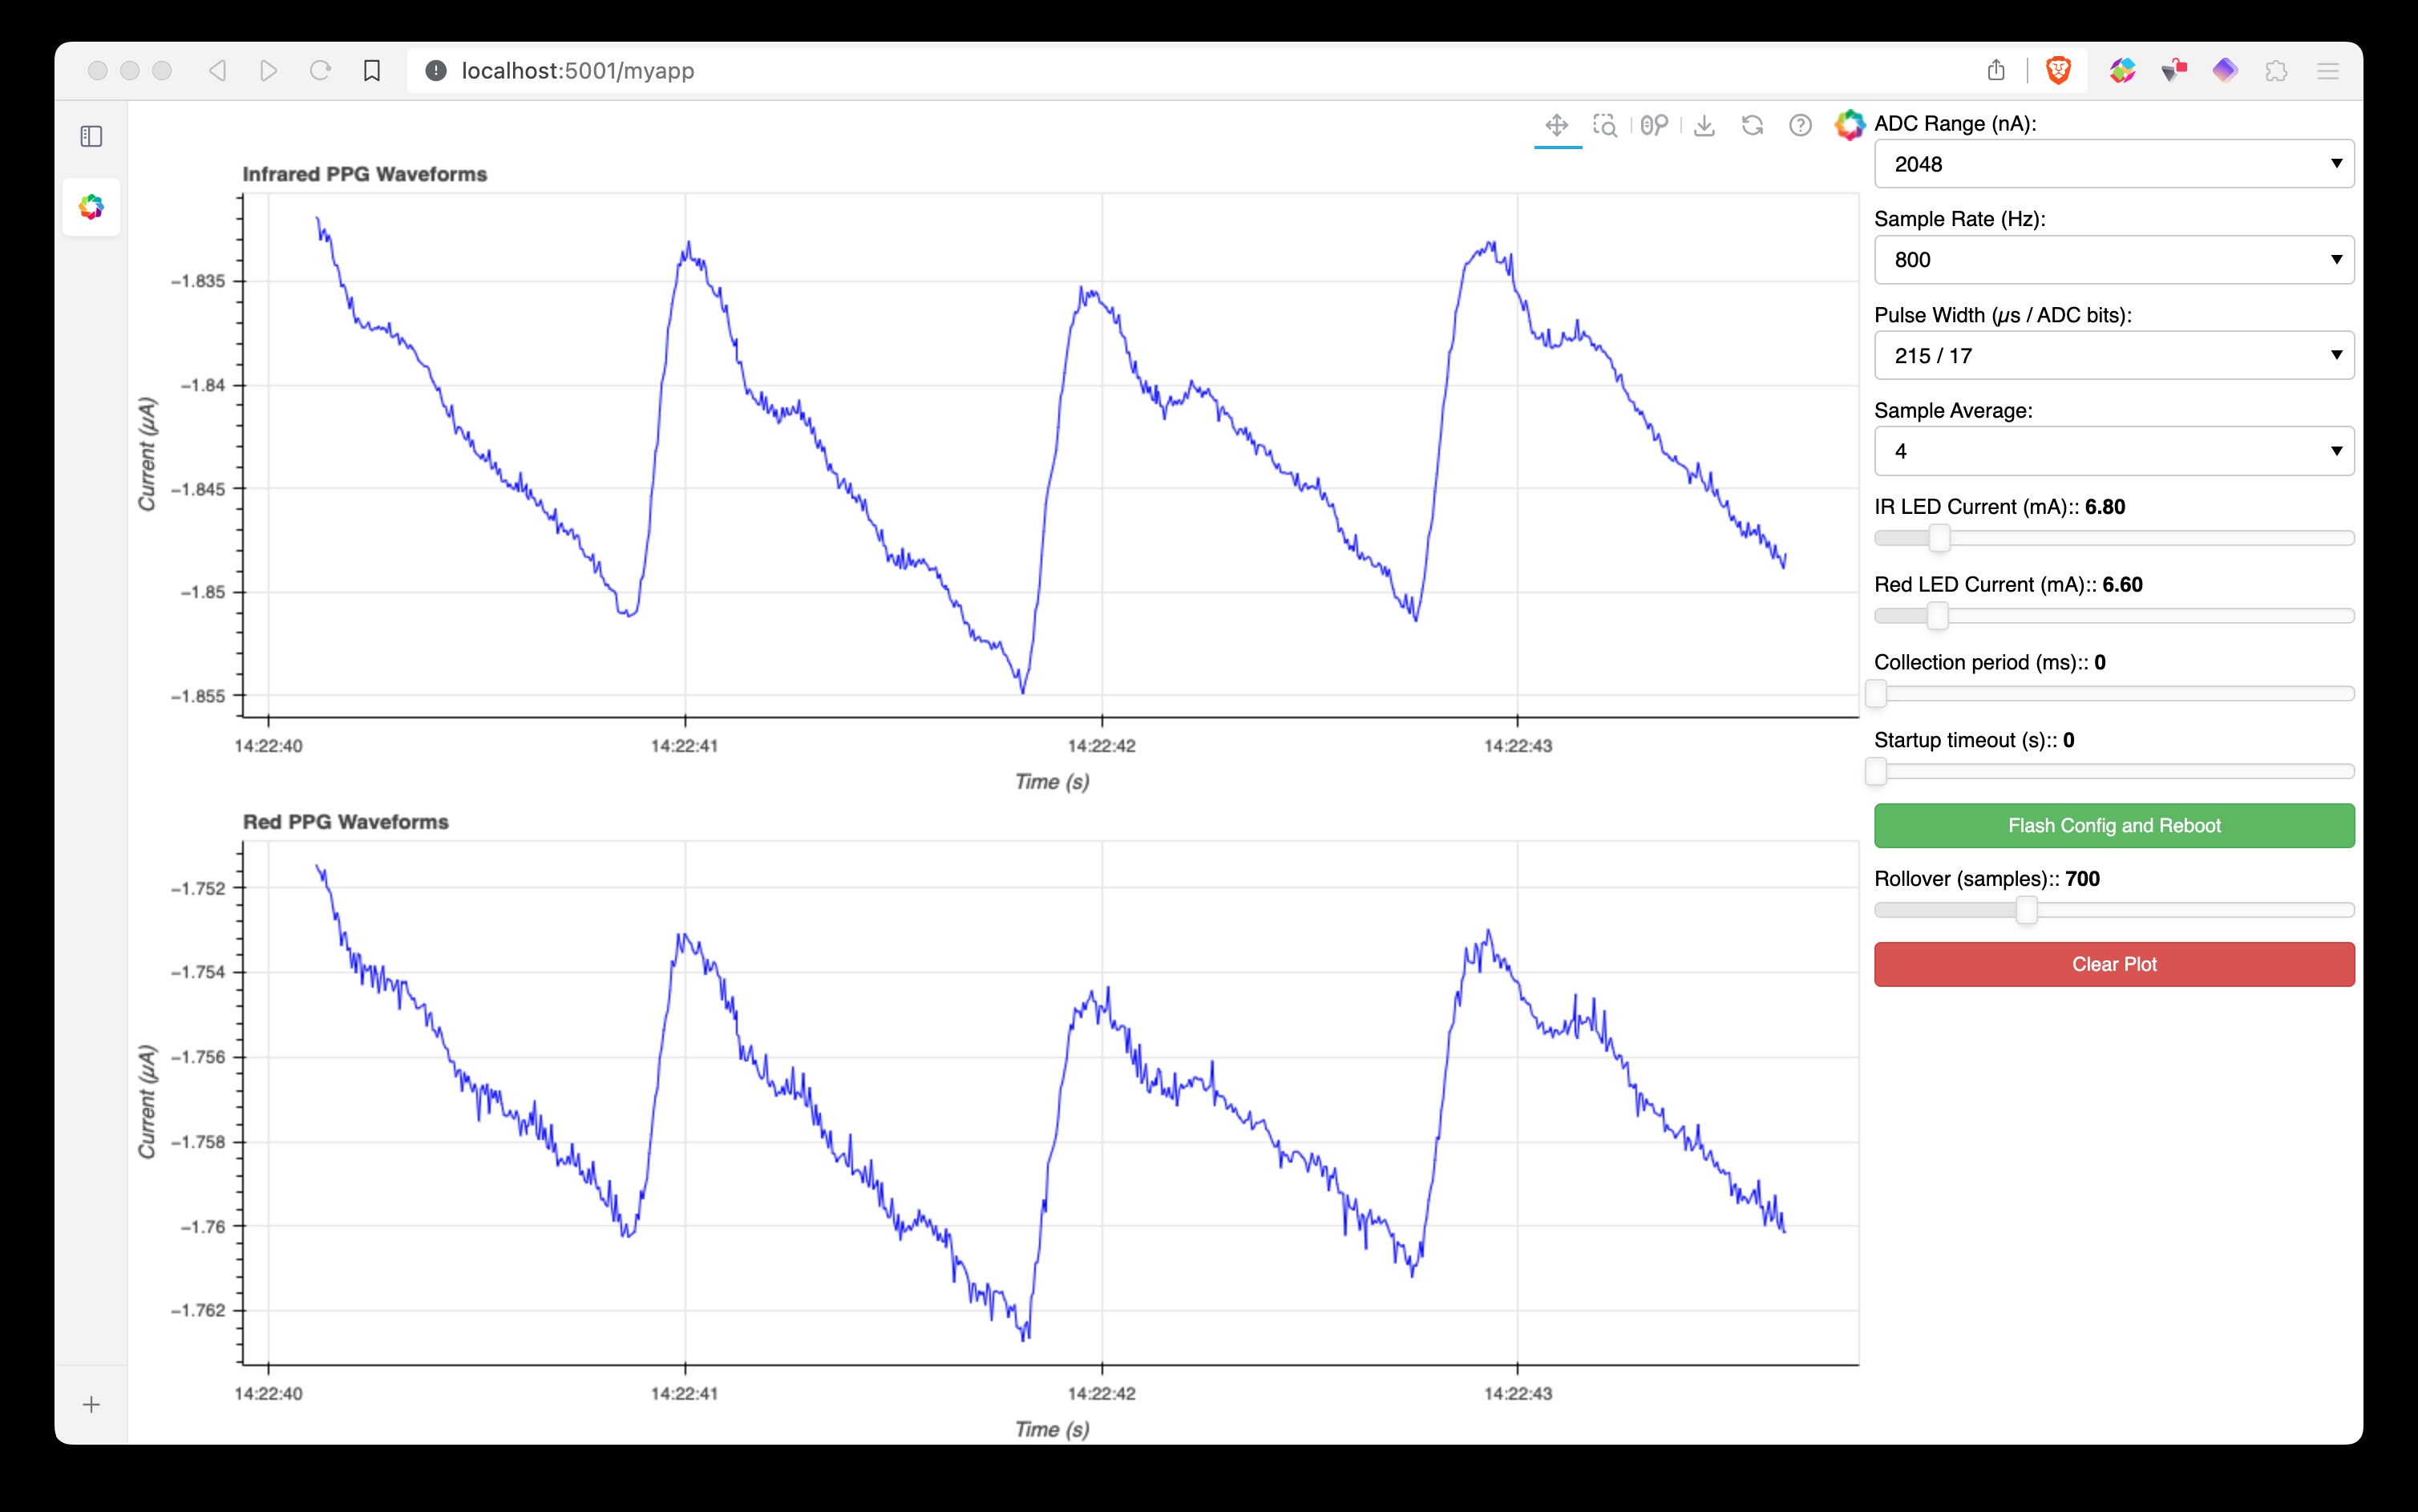
After the Auton Lab, I continued building tools to help out with various other projects. One example of this is a tool, PPGView, developed as part of the TEGSense project, to assist in our research on battery-free operation of wearable sensors by harvesting energy from body heat thermoelectric generators (Zadan et al., 2024). The tool allows for real-time data collection via Bluetooth low-energy (BLE) of a battery-free wearable I designed. It also supports device commands and configuration of the MAX30101 photoplethysmograph sensor. More details are on the project page, and the hardware and software are completely open-sourced.
A similar tool was developed at Arieca for real-time data capture and control of custom test hardware I developed for characterization of material degradation due to ion migration. More details can be found on the Ion Migration project page.
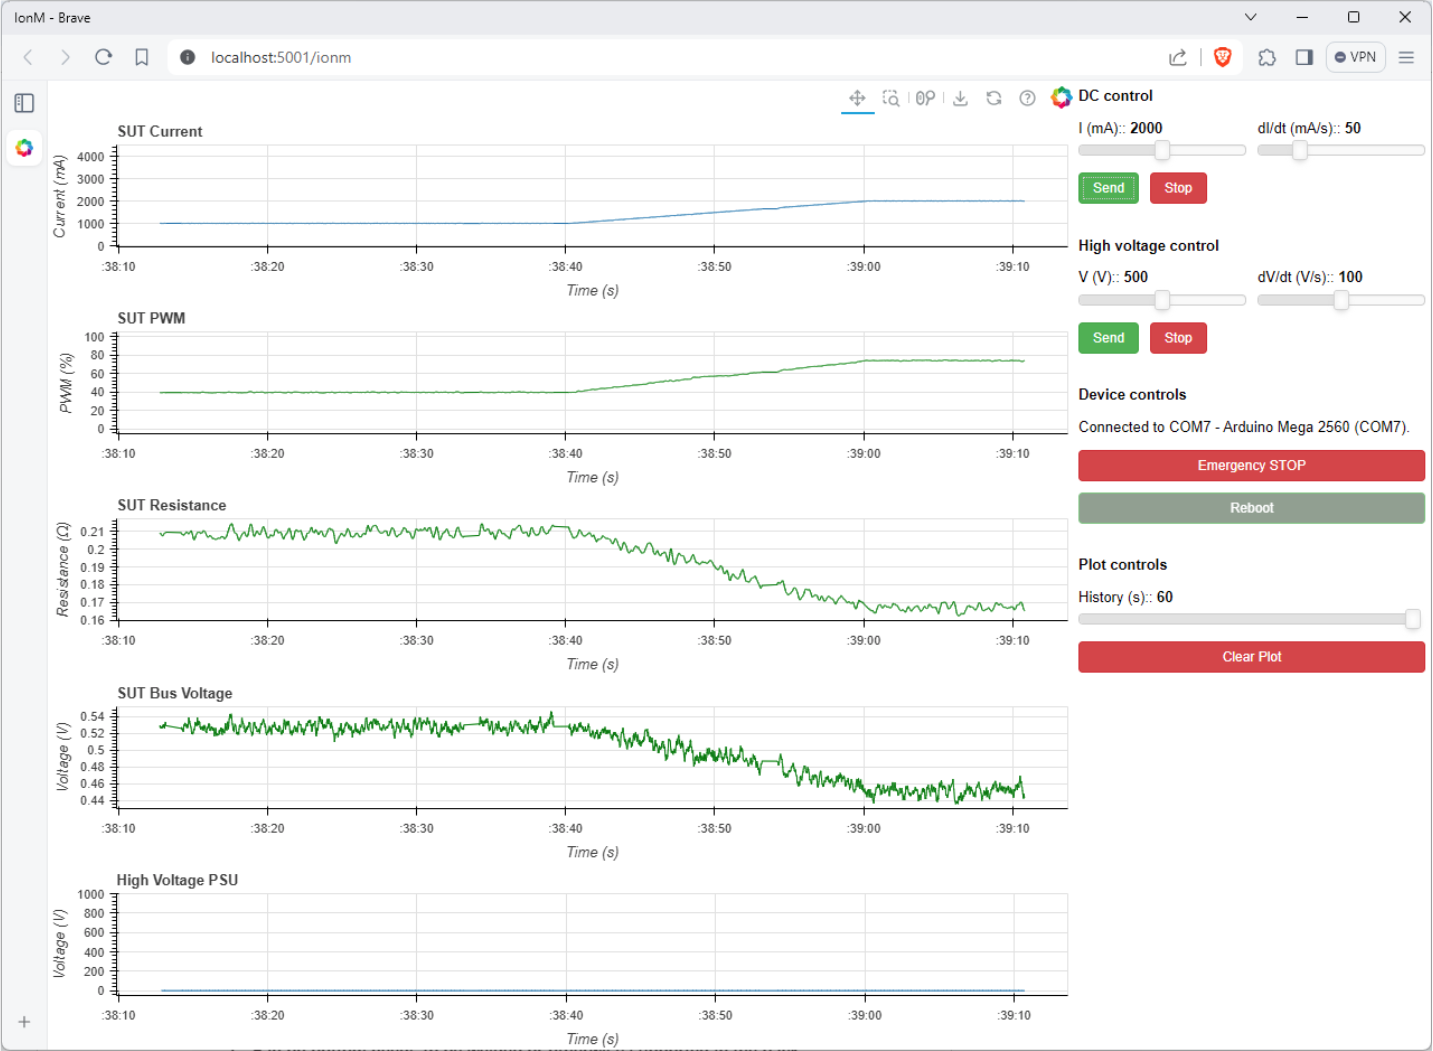
Developing tools to assist the research workflow has been very fun and rewarding. I am happy there are at least a few projects I am able to open and share here. Tip: I have grown very fond of bokeh for real-time visualization tools, I highly recommend checking it out.
- Laird, P., Wertz, A., Welter, G., Maslove, D., Hamilton, A., Yoon, J. H., Lake, D. E., Zimmet, A. E., Bobko, R., Moorman, J. R., & others. (2021). The critical care data exchange format: a proposed flexible data standard for combining clinical and high-frequency physiologic data in critical care. Physiological Measurement. https://doi.org/10.1088/1361-6579/abfc9b
- Liu, C., Gomez, H., Narasimhan, S., Dubrawski, A., Pinsky, M. R., & Zuckerbraun, B. (2015). Real-time visual analysis of microvascular blood flow for critical care. 2015 IEEE Conference on Computer Vision and Pattern Recognition (CVPR), 2217–2225. https://doi.org/10.1109/CVPR.2015.7298834
- Zadan, M., Wertz, A., Shah, D., Patel, D. K., Zu, W., Han, Y., Gelorme, J., Mea, H. J., Yao, L., Malakooti, M. H., Ko, S. H., Kazem, N., & Majidi, C. (2024). Stretchable Thermoelectric Generators for Self-Powered Wearable Health Monitoring. Advanced Functional Materials. https://doi.org/https://doi.org/10.1002/adfm.202404861
