Microcirculatory Bloodflow Analysis (MCBA)
Advances in signal processing and miniaturization of sensors and electronics have allowed biomedical technology to improve by leaps and bounds in the last decade. Processing imaging sensor data in particular has made strides in helping to analyze and understand complicated and noisy sensor data in radiology, tomography, among others. In the Auton Lab I had the opportunity to look at a measurement I was much less familiar with: capillary bloodflow.
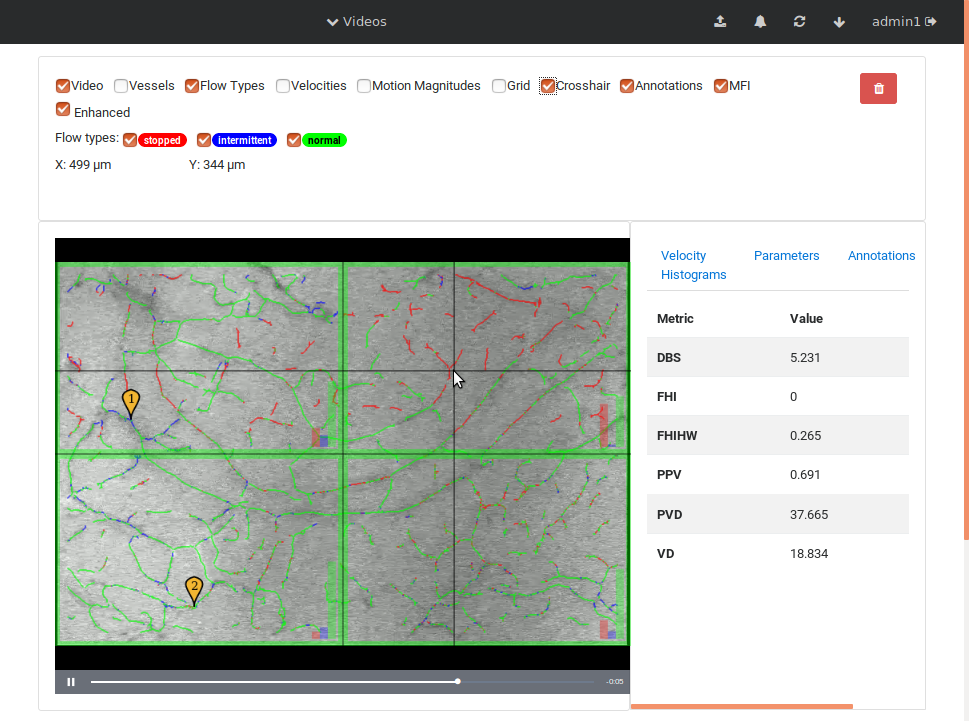
Figure 1: MCBA web interface for video processing and analysis.
Figure 2: Magnified microcirculatory flow to highlight clear bloodflow.
Figure 3: Stabilized video with vessel overlay.
I had the great privilege of working closely with Dr. Chao Liu, who was investigating computer vision techniques to process video taken of the microcirculation and extract quantifiable metrics to be used in the prediction of disease state. My role was to use my background in real-time software development to reimplement the processing and analysis pipeline to batch process many videos efficiently on a server backend and expose a frontend web interface for physician researchers to upload and process their own videos. This involved a lot of interesting challenges: first in understanding and reimplementing the processing pipeline; then in building an efficient server-side implementation; and finally in designing and deploying a user-friendly interface.
At a high level the pipeline consisted of a few important steps:
- Exposure throughout a video was normalized to a baseline to reduce processing mistakes due to changes in illumination and to standardize comparison across different videos;
- Video stabilization was performed to reduce noise due to camera or tissue movement;
- Background subtraction and motion magnification was performed to highlight the moving entities in the video (e.g., the blood cells themselves);
- Vessel center lines were identified to allow for flow quantification;
- Local vessel flow rates and patterns were identified and aggregated to provide some quantified metrics for understanding the microcirculation.
Efficient implementation required the use of optimized vision and linear algebra libraries, in this case OpenCV and Eigen3 using Intel’s BLAS implementation. It also required implementation using CUDA to run on NVIDIA GPUs for bulk processing of dense video data. Finally, where possible, multithreading was used to parallelize CPU-bound tasks.
All of this made available to physicians through a web user interface, including both a REST framework to interface with the backend processing pipeline and a front-facing web interface.
If you want to learn more about this method, I highly recommend checking out Chao’s article in CVPR (Liu et al., 2015).